Axis Ticks
Introduction
This section will describe the following:
- Tick Types
Different axis tick types. - Custom Ticks
Using custom ticks and placing them at arbitrary positions. - String Tokens
Using tokens in axis ticks to describe elements or tick values. - Tick Overrides
Using ticks to override the properties of a single or multiple ticks. - Styling
Ticks styling. - Tick Alignment
Aligning tick labels with tick marks.
The AxisTick object encapsulates information such as its value, appearance, and grid properties. It can also be used to override a single or range of ticks on an axis.
The Axis.DefaultTick property offers a tick object that will propagate it’s settings to all ticks on the axis. This provides a method of applying settings to all axis ticks quickly.
Another axis tick property is Axis.ZeroTick. This is the axis tick that is added to each numeric axis at its origin (0). This tick can be disabled by setting the property to null.
[C#]Chart.XAxis.ZeroTick = null;
[Visual Basic]Chart.XAxis.ZeroTick = Null
Modes
An axis tick can contain a numeric or time value as well as a string value depending on the type of axis used.
Normal Axis Ticks
[C#]AxisTick at = new AxisTick();
At.Value = 10;
[Visual Basic]Dim at As New AxisTick()
At.Value = 10
Range Ticks

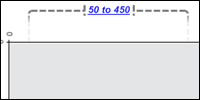
The tick can also represent a numeric or time range.
[C#]At.ValueHigh = 20;
At.ValueLow = 10;
[Visual Basic]At.ValueHigh = 20
At.ValueLow = 10
Marker Ticks

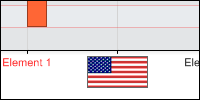
Both value and range ticks can be represented by an ElementMarker instead of a label.
[C#]
At.Marker = new ElementMarker(“images/myImage.gif”);

[Visual Basic]
At.Marker = New ElementMarker(“images/myImage.gif”)
Custom / Automatic ticks
The element object contains XAxisTick and YAxisTick properties. These are null by default, however, when instantiated, they will be drawn on the axis the elements belong to and will represent the element’s value.
 |
Sample: ElementTicks.aspx |
The AxisMarker also contains a single AxisTick property. When instantiated, it will represent the marker’s value or range as a range tick, depending on the marker's value.
 |
Sample: AxisMarkerTicks.aspx |
 |
AxisTick.AffectAxisScale can by used by custom ticks to affect the scale of the axis its added to. See Axis Scale > Scale Influentials above. |
Custom axis ticks can be added to any value axis like so:
[C#]Chart.XAxis.ExtraTicks.Add(At);
[Visual Basic]Chart.XAxis.ExtraTicks.Add(At)
To quickly add multiple axis ticks you can also list them as parameters in the Add method.
[C#]Chart.XAxis.ExtraTicks.Add(at1, at2, at3, at4);
[Visual Basic]Chart.XAxis.ExtraTicks.Add(at1, at2, at3, at4)
Tokens
Tick labels on a category axis can use tokens to display information about element groups they represent. For example the default category tick’s label is “%Name” which will show the element’s name.
Ticks assigned to elements (Element.YAxisTick & Element.XAxisTick) can also use tokens to describe the elements they represent.
 |
Sample: elementTemplate.aspx |
(New in 3.1) Tick labels in a numeric or time axis can also use tokens. A single value tick uses the token '%Value'. A range tick can use either the value token or any tokens related to the ScaleRange object. This functionality is useful with time scales because it allows you to break the time label into multiple lines as the following sample demonstrates:
 |
Sample: AxisTickToken.aspx |
See also: Token Reference
Overrides

A tick added to an axis that already contains a tick with the same value will update the old tick properties with its own. For example, if an axis shows a tick at 20 we can override it to display some different text using this code:
[C#]AxisTick at = new AxisTick();
At.Value = 20;
At.Label.Text = “Twenty”;
XAxis.ExtraTicks.Add(At);
[Visual Basic]Dim at As New AxisTick()
At.Value = 20
At.Label.Text = “Twenty”
XAxis.ExtraTicks.Add(At)
If a tick at 20 didn’t exist, it would be added as an additional tick.
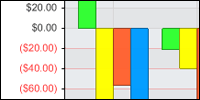
A tick can also be used to propagate its settings to a range of ticks. Consider a scale from -100 to 100. If we wanted to color all the negative values red we could do so with the following code:
[C#]AxisTick at = new AxisTick();
At.ValueHigh = -1;
At.ValueLow = -100;
At.Label.Color = Color.Red;
At.OverrideTicks = true;
XAxis.ExtraTicks.Add(At);
[Visual Basic]Dim at As New AxisTick()
At.ValueHigh = -1
At.ValueLow = -100
At.Label.Color = Color.Red
At.OverrideTicks = True;
XAxis.ExtraTicks.Add(At)
 |
Notice that the AxisTick.OverrideTick setting is required so the axis knows whether to treat the tick as an override or regular range tick. |
Styling
The AxisTick object can control its appearance as well as the grid line that stems from it. The TickLine property can also take advantage of the Line.Length property.
Some styling examples:
[C#]
AxisTick at = new AxisTick();At.Label.Font = new Font(“Verdana”,10);
At.Line.Length = 8;
At.GridLine.DashStyle = Dash;
[Visual Basic]
Dim at As New AxisTick()At.Label.Font = New Font(“Verdana”,10)
At.Line.Length = 8
At.GridLine.DashStyle = Dash
The axis contains properties that also modify the axis tick appearance.
- TickLabelMode
This enumeration allows you to specify the layout behavior of ticks. - TickLabelPadding
A numeric value in pixels that indicates the distance between a tick line and the label. - TickLabelSeparatorLine
Between each tick mark a line can be drawn to accentuate tick label separation. This line is automatically enabled when tick labels decide to wrap.
Tick Alignment
Tick marks can also be drawn between each tick label instead of above it. This is done by setting Axis.CenterTickMarks to false. When this is the case, only Axis.DefaultTick properties are used instead of individual tick line properties because not every tick mark will pertain to a label.
 |
Tip: Centered tick marks are commonly used with category axes [ Group A , Group B, …] and sometimes with time axes [ May, June, … ] |


